How to Find Viral E-commerce Ads Before They Saturate (TrendTrack Guide)
The Window That Most Advertisers Miss
Finding viral ecom ads before they saturate is one of the highest-leverage skills in e-commerce. The difference between entering a trend on day 3 and day 30 is the difference between a 5x ROAS and a break-even test. Yet most dropshippers and DTC brands operate on a lag — they see a product everywhere and assume it's still worth entering, when in reality the opportunity closed two weeks ago.
This guide covers the exact signals you need to identify an ad that's going viral early, how to verify it's not already dead, and how to use TrendTrack's data to act before the market catches up.
What Makes an E-commerce Ad Go Viral
A viral e-commerce ad isn't just one with high views. In the context of paid advertising, viral means: an ad creative is being scaled aggressively because the market is responding. The mechanics are specific — a hook that triggers emotional response, an offer that feels like obvious value, and a product that solves a visible problem.
The challenge is that by the time an ad visibly dominates your feed, it's already been running for weeks. The brands entering now are chasing a signal that early movers already captured. Your goal is to identify the ad in the 200K–500K impression range — the phase where it's proven enough to be worth acting on, but not yet so saturated that margins have collapsed.
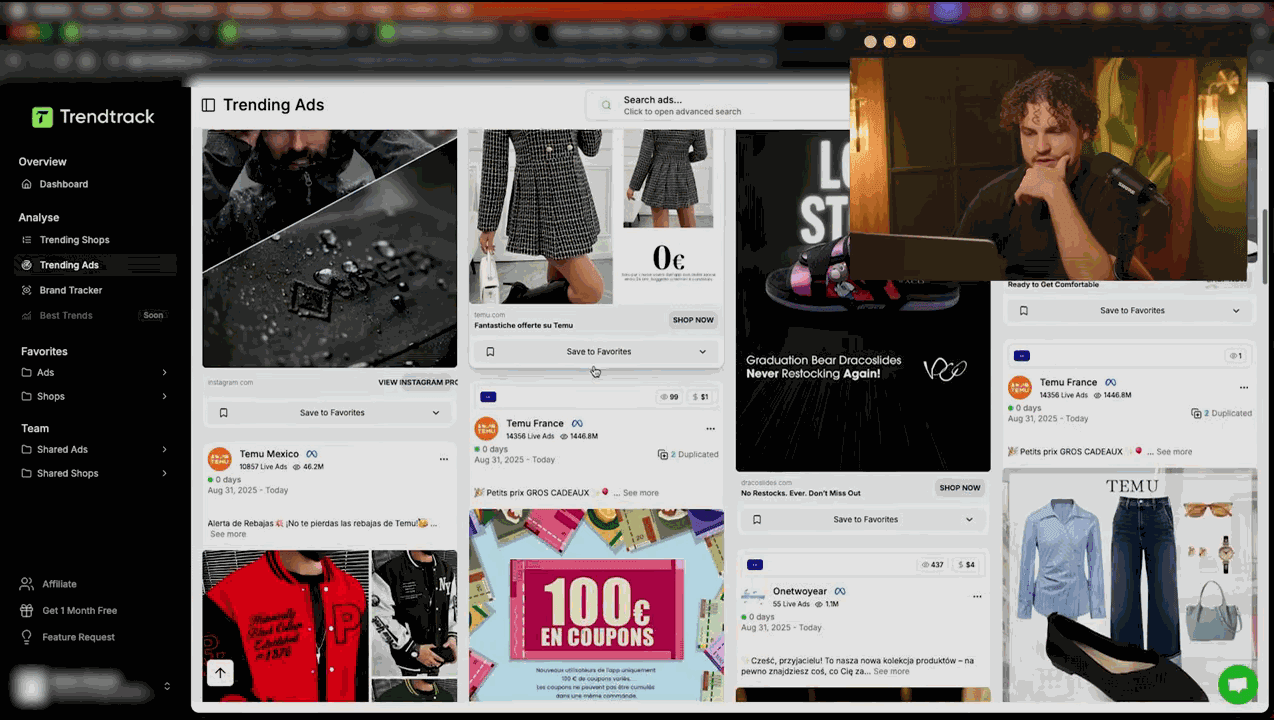
Step 1: Filter TrendTrack for Active Ads with Recent Launch Dates
In TrendTrack's ad library of 174M+ ads, start by filtering aggressively:
- Status: Active only — inactive ads tell you what worked, not what's working now
- Launch date: Last 14 days — you want early-stage ads, not established campaigns
- Minimum ad duration: 7 days — proves the ad has survived initial testing and Facebook's algorithm isn't cutting it
- Minimum impressions: 200K — below this threshold, you're looking at tests, not winners
This combination surfaces ads that are new enough to still have runway, but old enough to have proven initial traction. You can refine further by category, keyword, or ad format depending on your niche. For a detailed walkthrough of filter combinations, see our complete TrendTrack filter guide.
TrendTrack also supports multi-keyword search with a semicolon separator — useful for scanning across multiple product angles simultaneously rather than running separate searches.
Want to try this yourself? Start a free TrendTrack account →
Step 2: Apply the Impression Threshold Framework
Impression data is the heartbeat of viral ad detection. TrendTrack's EU/UK impression data comes from Meta's Digital Services Act transparency obligations — actual reported numbers, not panel estimates. Use this framework to categorize every ad you evaluate:
| Impression Range | Phase | Entry Decision |
|---|---|---|
| Under 200K | Testing | Monitor only — not yet validated |
| 200K – 500K | Early viral | Best entry window — proven but not saturated |
| 500K – 1M | Scaling hard | Still actionable with a differentiated angle |
| 1M+ | Peak / possible decline | High saturation risk — enter only with strong differentiation |
The 200K–500K window is your sweet spot. The advertiser has spent enough to prove the creative works, but the broader market hasn't piled in yet. An ad crossing from 200K to 500K impressions over 7 days is accelerating — that's the clearest early-viral signal available.
Pair impression count with the 14-day daily average trend. An ad whose daily impressions are climbing is in growth phase. Flat or declining daily averages at 600K total may mean the advertiser is already pulling back — which means the product window is closing, not opening.
How to Differentiate Early-Viral from Already-Dead Trends
This is the mistake that costs dropshippers the most: confusing a large impression number with a current opportunity. An ad can have 2M impressions and be completely dead — all those impressions happened three months ago, and the product is now in every Shopify template store on the internet.
Three checks to run before acting:
- Check the last active date: If an ad's last impression was more than 10 days ago, it's not active regardless of total count. TrendTrack shows this clearly in the ad detail view.
- Check the daily average trend: A falling 14-day average on a high-impression ad means the advertiser is scaling down, not up.
- Check how many stores are running the same product (covered in Step 4): If 30+ stores are already selling it, the trend is old.
The best viral ads to act on are those with moderate total impressions (200K–700K), a rising daily average, and fewer than 15 stores currently running the product.
Step 3: Verify Store Signals with TrendTrack
An ad that's going viral is usually backed by a store that's scaling. TrendTrack lets you click through from any ad directly to the advertiser's store profile. Check these signals:
- Traffic trend: Is store traffic growing week over week? Use the multiplier: TrendTrack shows approximately one-third of real traffic, so a store showing 100K monthly visits is likely doing 300K in reality.
- App stack: A store running Triple Whale (which costs $100+/month) is a sophisticated operator making real money. A store running Parcel Panel is handling high order volume. These signals confirm that the revenue behind the scaling is real.
- Store age: A store launched 6+ months ago that's now scaling hard is more credible than a 3-week-old store with similar traffic — the latter may be a quick-flip test.
- Product count: A store with 1-3 products pushing one heavily is a focused operator betting on this specific item. That focus is a positive signal for the product's potential.
You can also access this store data directly via TrendTrack's Chrome extension, which surfaces creation date, theme, traffic, apps, and pixels on any Shopify store you visit. It's free and rated 4.9/5 with 10K+ users. See our Chrome extension guide for setup instructions.
Ready to find your next winner? Try TrendTrack free — no credit card needed →
Step 4: Run the Saturation Check
Before committing budget or sourcing inventory, run a saturation check. In TrendTrack's store database of 1.5 million Shopify stores, search for the product using keywords from the ad creative. Apply a filter for stores actively running ads for this product.
Use this decision framework:
- 1-10 stores: Very early — maximum opportunity, but also highest execution risk
- 10-20 stores: Early-to-mid — strong opportunity with some validation
- 20-30 stores: Mid-stage — still worth entering with a differentiated angle or better creative
- 30+ stores: Crowded — saturation is advanced; enter only if you have a structural cost or brand advantage
The 30-store threshold is a hard signal. When 30+ stores are all pushing the same product with similar creative, CPMs have typically risen, audiences have been worn out across multiple campaigns, and the price sensitivity on the product has increased as buyers compare options. The margin on a saturated product is a fraction of what an early mover captured.
The 5th-12th of Month Timing Strategy
One underused tactical insight: the best time to launch a new product based on a viral ad signal is between the 5th and 12th of the month. Here's why:
Consumer spending on Facebook tends to be highest in the first half of the month, when recent paychecks have cleared. Advertisers who know this schedule their biggest pushes to align with it. Launching your own campaign to coincide with this window means your ads will reach audiences who are actively in buying mode — not the depleted, ad-fatigued audiences of the last week of the month.
If you spot a viral ad signal on the 20th, don't rush a half-ready launch. Use those 10-15 days to source the product, prepare creative, and build your funnel. Then launch clean on the 5th of the following month. You'll get better data faster and spend less to validate.
Creative Analysis: Study What's Working, Then Differentiate
Once you've confirmed a viral ad opportunity, don't copy the creative — study it. Fresh angles improve conversion rates by 15–25% compared to recycled creative. The goal is to understand why the original creative works, then execute a differentiated version.
Break down the winning ad:
- Hook (first 3 seconds): What emotion does it trigger? Fear, curiosity, desire, social proof?
- Problem framing: What problem does it identify, and how specifically does it name it?
- Offer structure: Is the CTA discount-based, urgency-based, or value-based?
- Visual approach: UGC-style, polished studio, comparison format, or demo?
Then ask: what angle is missing from the current competitive creative? If every ad shows the product being used, try showing the result. If every ad uses a female presenter, test a male presenter. These pivots let you enter a proven market without competing head-to-head on the same creative.
For a complete framework on creative analysis, see our tutorial on analyzing winning ad creatives with TrendTrack.
See these features in action: Get 20% off your first plan →
Putting It Together: A Practical TrendTrack Weekly Workflow
Run this process twice a week to maintain a pipeline of viral ad opportunities:
- Filter TrendTrack for active ads launched in the last 14 days with 200K+ impressions and 7+ days duration
- Sort by fastest-growing daily impressions
- For each top result: check store signals, run the saturation count, note the impression trajectory
- Flag anything under 20 stores with rising daily impressions — these go into your opportunity pipeline
- Schedule launch for the next 5th-12th window if sourcing allows
TrendTrack's pre-made segments — Weekly Gems, Top Scaling, and Market Leaders — can shortcut step 1 by surfacing already-curated lists of trending products. These are good starting points, though you should still run your own impression and saturation checks rather than acting on the segment alone.
For pricing details on plans that include the full ad library and impression data, see the TrendTrack pricing page — the Starter plan at $59/month gives you access to the core ad intelligence features. For a broader comparison of how TrendTrack stacks up against other viral ad discovery tools, read our TrendTrack vs Minea comparison or the full alternatives overview. And for a complete evaluation of the platform, our TrendTrack review covers every feature in depth.

Arnaud
E-commerce entrepreneur and tool tester since 2020. I analyze spy tools and e-commerce intelligence platforms to help dropshippers and online sellers make the right choices.