E-commerce Intelligence for Beginners: A TrendTrack Guide
What Is E-commerce Intelligence?
E-commerce intelligence is the practice of using data to make better business decisions in online selling. Instead of guessing which products to sell, which markets to enter, or which ad creatives to run, you analyze real data from existing stores, ads, and market trends to inform your strategy.
Think of it this way: before e-commerce intelligence tools existed, launching an online store was essentially gambling. You picked a product based on intuition, designed a store based on personal taste, and created ads based on assumptions. The failure rate was astronomical. Today, tools like TrendTrack give you access to data on nearly 1.5 million Shopify stores and over 174 million ads, turning guesswork into informed decision-making.
Why Data-Driven Decisions Matter
The statistics are sobering. Roughly 90% of e-commerce businesses fail within their first year. The vast majority fail not because of execution problems but because of selection problems — they chose the wrong product, the wrong market, or the wrong positioning.
Data-driven sellers dramatically reduce this failure rate by validating their decisions before committing resources. When you can see that a product is already generating millions in revenue for other stores, that specific ad creatives are accumulating hundreds of thousands of impressions, and that the market is growing rather than shrinking — you are not guessing. You are making informed bets.
This does not guarantee success. Execution still matters. But it eliminates the most common reason for failure: choosing a product nobody wants. Read our detailed TrendTrack review to see how the platform supports this data-driven approach.
The 3 Types of E-commerce Data
All e-commerce intelligence revolves around three types of data. Understanding these is foundational.
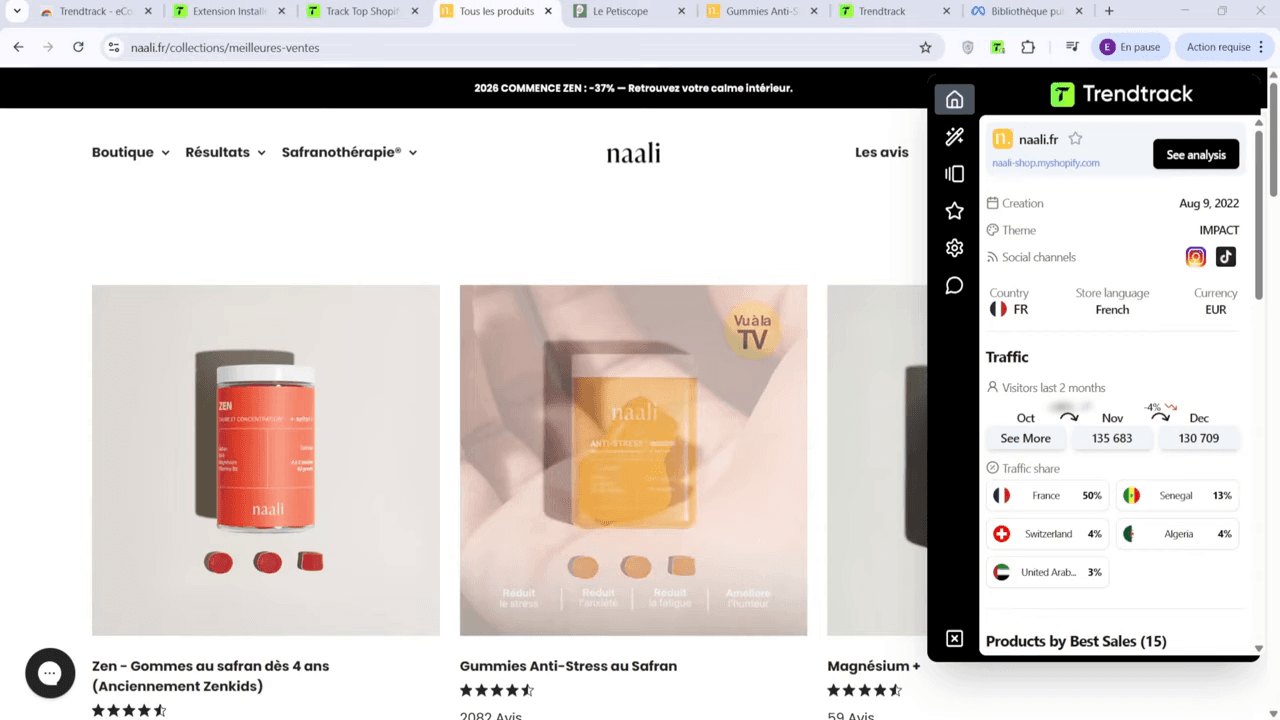
1. Traffic Data
Traffic data tells you how many people visit a store, where they come from, and how that traffic is changing over time. Key metrics include:
- Monthly visitors: The total number of people visiting a store each month
- Traffic growth: How fast traffic is increasing or decreasing
- Traffic sources: Whether visitors come from ads, organic search, social media, or direct visits
- Geographic distribution: Which countries the visitors are in
Traffic data is a proxy for revenue. A store with 100,000 monthly visitors and healthy traffic growth is almost certainly generating significant revenue. In e-commerce, a rough rule of thumb is approximately 1 euro per visitor per month for a well-optimized store.
2. Ad Data
Ad data tells you what marketing messages are in the market, how much is being spent, and what is working. Key metrics include:
- Impressions: How many times an ad has been shown
- Active duration: How long an ad has been running continuously
- Creative format: Video, image, carousel, or dynamic creative
- Target markets: Which countries and demographics the ad targets
- Ad copy: The text, headlines, and calls-to-action used
Ad data is the most direct signal of what is profitable. Learn how to decode it in our ad creative analysis guide. An ad that has been running for 30+ days is almost certainly making money for the advertiser — they would not keep paying for it otherwise.
3. Store Data
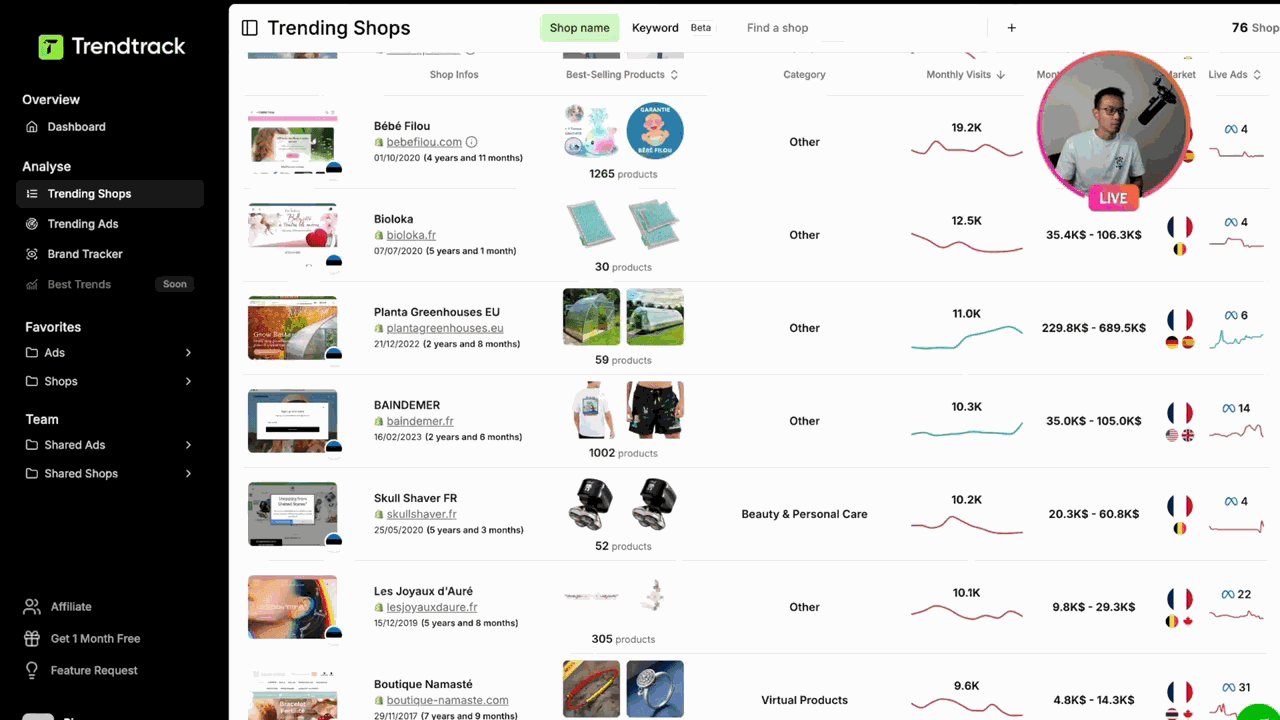
Store data tells you about the business behind the ads: what they sell, how they are set up, and how sophisticated their operation is. Key metrics include:
- Product catalog: What products the store sells and at what prices
- Technology stack: Which Shopify theme, apps, and tracking tools they use
- Store age: How long the store has been operating
- Shopify plan: Which plan they are on (indicates revenue level)
Store data helps you validate findings from traffic and ad data. A store with high traffic, lots of active ads, and professional tools like Triple Whale and Klaviyo is a confirmed serious operator.
Want to try this yourself? Start a free TrendTrack account →
The E-commerce Intelligence Workflow
Data-driven e-commerce follows a consistent workflow, regardless of the specific tools you use:
- Research: Identify potential products by analyzing successful stores and ads in your target market. Look for products meeting the three criteria: massive TAM (Total Addressable Market), instant WOW effect, and solving a daily pain point. Our winning products guide explains each criterion in depth.
- Validate: Cross-reference your findings. A product should show up in both store data (stores selling it are growing) and ad data (ads for it have high impressions). Multiple signals increase confidence.
- Source: Find a supplier. Use platforms like AliExpress for testing or Alibaba for scale. Evaluate cost, shipping time, product quality, and minimum order quantities.
- Build: Create your store. Focus on functionality over aesthetics at first. A clean, fast, mobile-friendly store with good product photos and persuasive copy converts better than a beautiful but slow one.
- Launch: Start advertising. Your ad creatives should be informed by what you learned in the research phase — use proven formats, hooks, and messaging styles.
- Iterate: Analyze your results and adjust. Kill what does not work, scale what does. Return to the research phase when you need new products or creative inspiration.
Key Concepts to Understand
Total Addressable Market (TAM)
TAM is the total number of potential customers for your product. A posture corrector has a TAM of hundreds of millions (most adults have posture issues). A left-handed calligraphy pen for Japanese characters has a TAM of maybe a few thousand. Both can be profitable, but massive TAM makes scaling much easier and forgives mistakes.
Time to Market
In e-commerce, speed matters more than perfection. A good product launched this week beats a perfect product launched next month. The market moves fast — trends emerge, peak, and saturate within weeks or months. Your research workflow should be measured in days, not weeks.
Winning Product
A winning product is one that generates profit at scale through paid advertising. Not every good product is a winning product. The product must have high enough margins to cover ad costs while still generating profit, and the market must be large enough to scale advertising without exhausting the audience.
Starting for Free with TrendTrack
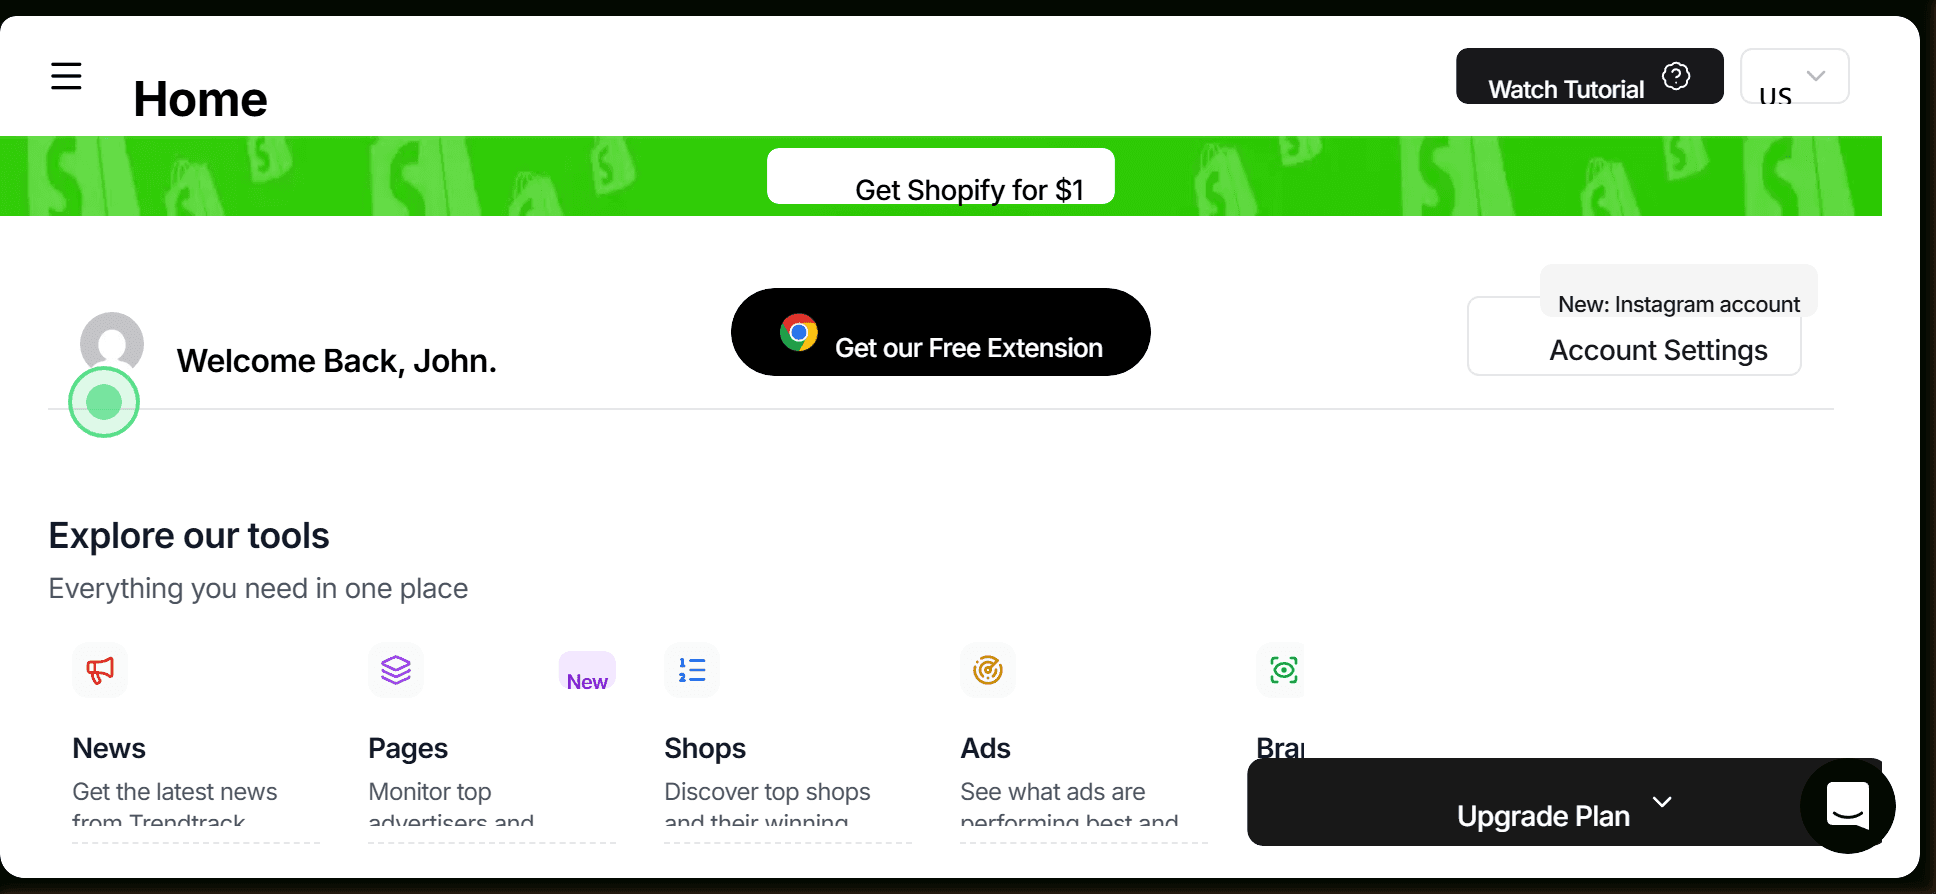
You do not need to invest money before investing time in learning. TrendTrack offers a free account and 7 free tools that are enough to start your intelligence practice:
- Chrome Extension: Analyze any Shopify store you visit — traffic, products, apps, pixels, social links
- Profit Margin Calculator: Calculate margins instantly when evaluating products
- Shopify Subscription Calculator: Understand true Shopify costs including fees
- ROAS Break Even Calculator: Know your minimum profitable ad performance
- Shopify Apps Detector: Check any store's tech stack
- Shopify Theme Detector: Identify themes for design inspiration
- Shopify Product Exporter: Export competitor product catalogs for analysis
Use these tools to build your research muscles before committing to a paid subscription.
Ready to find your next winner? Try TrendTrack free — no credit card needed →
When to Upgrade to a Paid Plan
The free tools are sufficient for learning and initial exploration. You should consider upgrading when:
- You want to search and filter across the full database of nearly 1.5 million stores — our advanced filters guide shows you how
- You need to track competitors systematically with Brand Tracker
- You want access to ad impression data and EU/UK spending estimates
- You are ready to use advanced filter combinations for product research
- Your e-commerce business is generating revenue and the tool cost is a legitimate business expense. See how TrendTrack stacks up in our full tool comparison
TrendTrack's plans start at €59/month (Starter), with the Pro plan at €89/month being the most popular. Visit the pricing page for current rates and discounts. Annual billing saves 30%.
Common Beginner Mistakes
Avoid these pitfalls that trap most new e-commerce sellers:
- Analysis paralysis: Spending weeks researching without ever launching. Set a deadline for your research phase and stick to it.
- Ignoring data: Falling in love with a product despite data showing no market demand. Trust the numbers over your gut feeling.
- Copying exactly: Reproducing a competitor's store and ads identically. Use intelligence for inspiration, not plagiarism. Add your own angle.
- Skipping validation: Launching based on a single data point. Our FAQ section addresses the most common validation questions. Always cross-reference store data with ad data with market research.
- Underestimating ad spend: Expecting profit on day one with a $10/day budget. Budget at least $50-100/day for meaningful testing.
Realistic Timeline: What to Expect
Set realistic expectations. Here is what a disciplined, data-driven approach typically looks like:
- Month 1 — Learning: Install free tools, learn the interface, study 50+ stores and 100+ ads, build your research framework. No revenue yet, and that is normal.
- Month 2 — Testing and Scaling: Launch your first product with validated data. Test 5-10 ad creatives. Expect some losses as you optimize. First sales should start appearing.
- Month 3 — Optimization and Profit: Kill losing products, scale winners. Optimize ad creatives based on data. First consistent profit is realistic for disciplined operators.
Some people achieve results faster, some slower. The key variable is not intelligence or luck — it is consistency and willingness to follow the data even when it contradicts your preferences.
See these features in action: Get 20% off your first plan →
Conclusion
E-commerce intelligence transforms online selling from gambling into a systematic business. By understanding the three types of data (traffic, ads, stores), following a structured research workflow, and using tools like TrendTrack to access real market data, you dramatically increase your odds of building a profitable online business. Start free, learn the fundamentals, and upgrade your tools as your business grows. The 90% failure rate applies to those who guess. Data-driven sellers play a different game entirely. The tools are accessible (compare your options on our alternatives page), the data is available, and the learning curve is shorter than most people think. Start today with a free account, explore the data, and build the habits that will serve you throughout your e-commerce career.

Arnaud
E-commerce entrepreneur and tool tester since 2020. I analyze spy tools and e-commerce intelligence platforms to help dropshippers and online sellers make the right choices.